How the data moves
Nobody exports anything
Each source is read on a schedule into one data model. Every department opens its own pages, with the same numbers underneath.
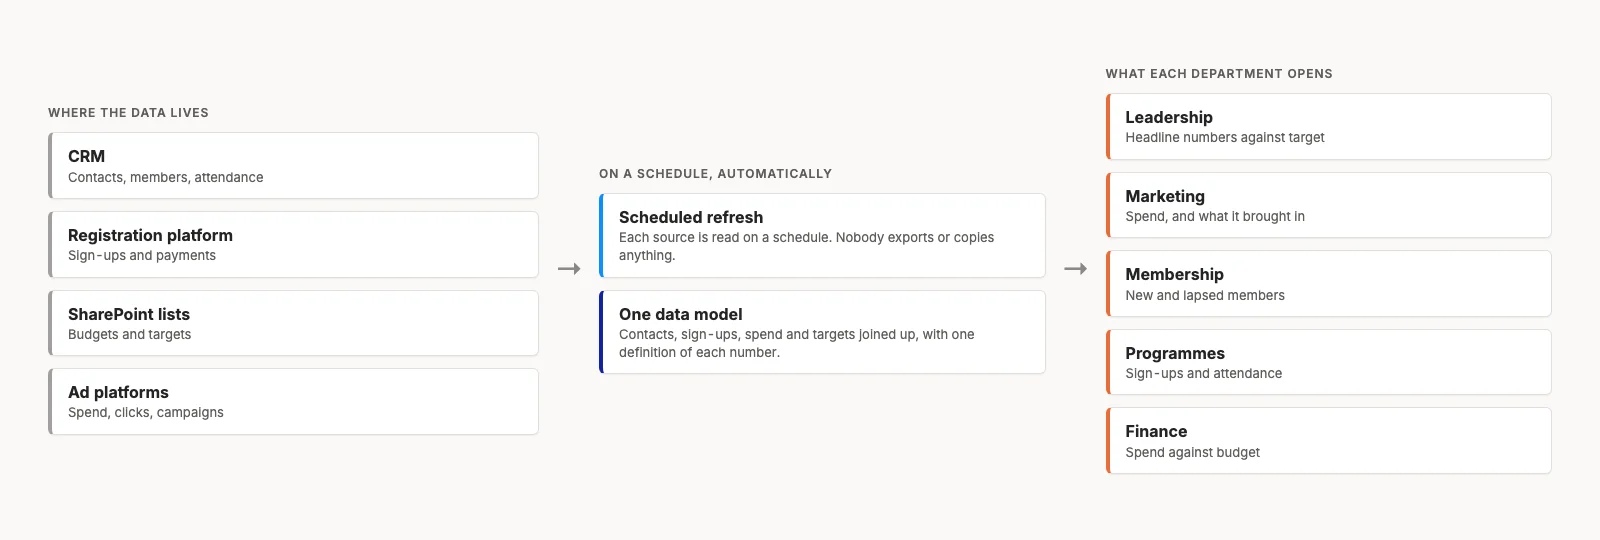
An organisation's numbers were spread across a CRM, a registration platform, SharePoint lists and its ad accounts. Now they flow into Power BI on a schedule, and every department works from the same up-to-date picture.
Each system kept its own numbers and its own reports. Nobody could see the whole picture in one place, and putting it together by hand was slow.
Automated feeds from each source into one Power BI data model, refreshed on a schedule. Each department has its own report pages, built on the same numbers underneath.
The marketing team said having the numbers in front of them made a big difference: they could adapt their plans and got better results than they had without that visibility.
Each source is read on a schedule into one data model. Every department opens its own pages, with the same numbers underneath.
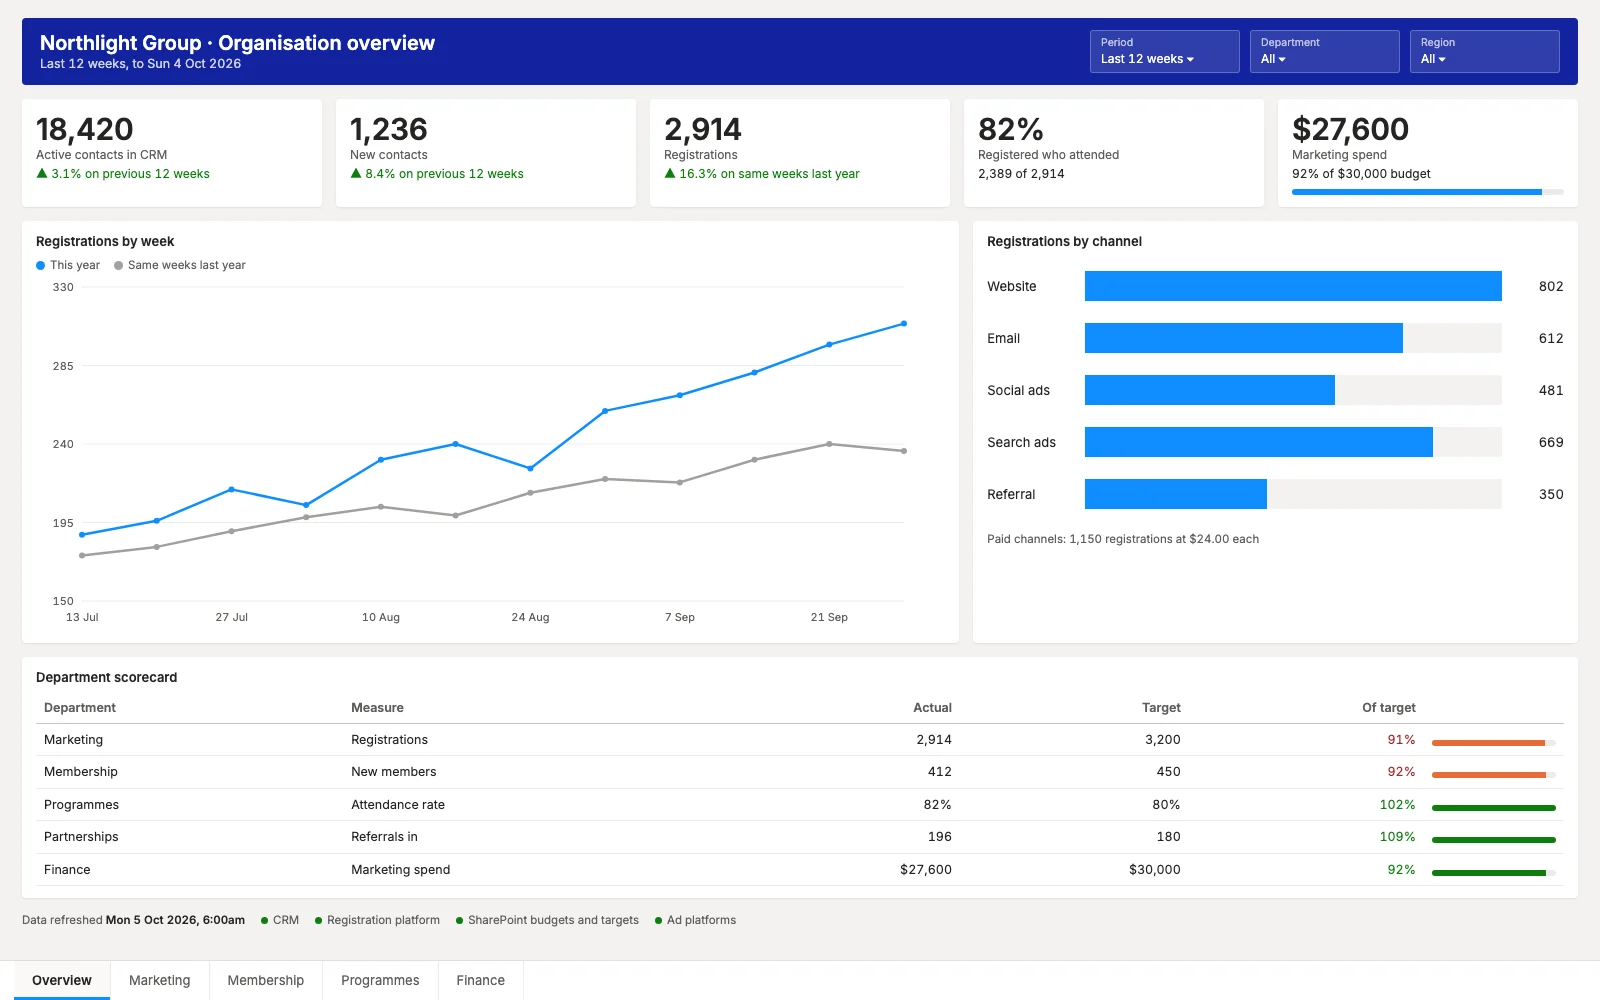
Headline numbers for each department against target, this year against last, and where sign-ups are coming from. Every number has one definition, and the page says when the data was last refreshed.
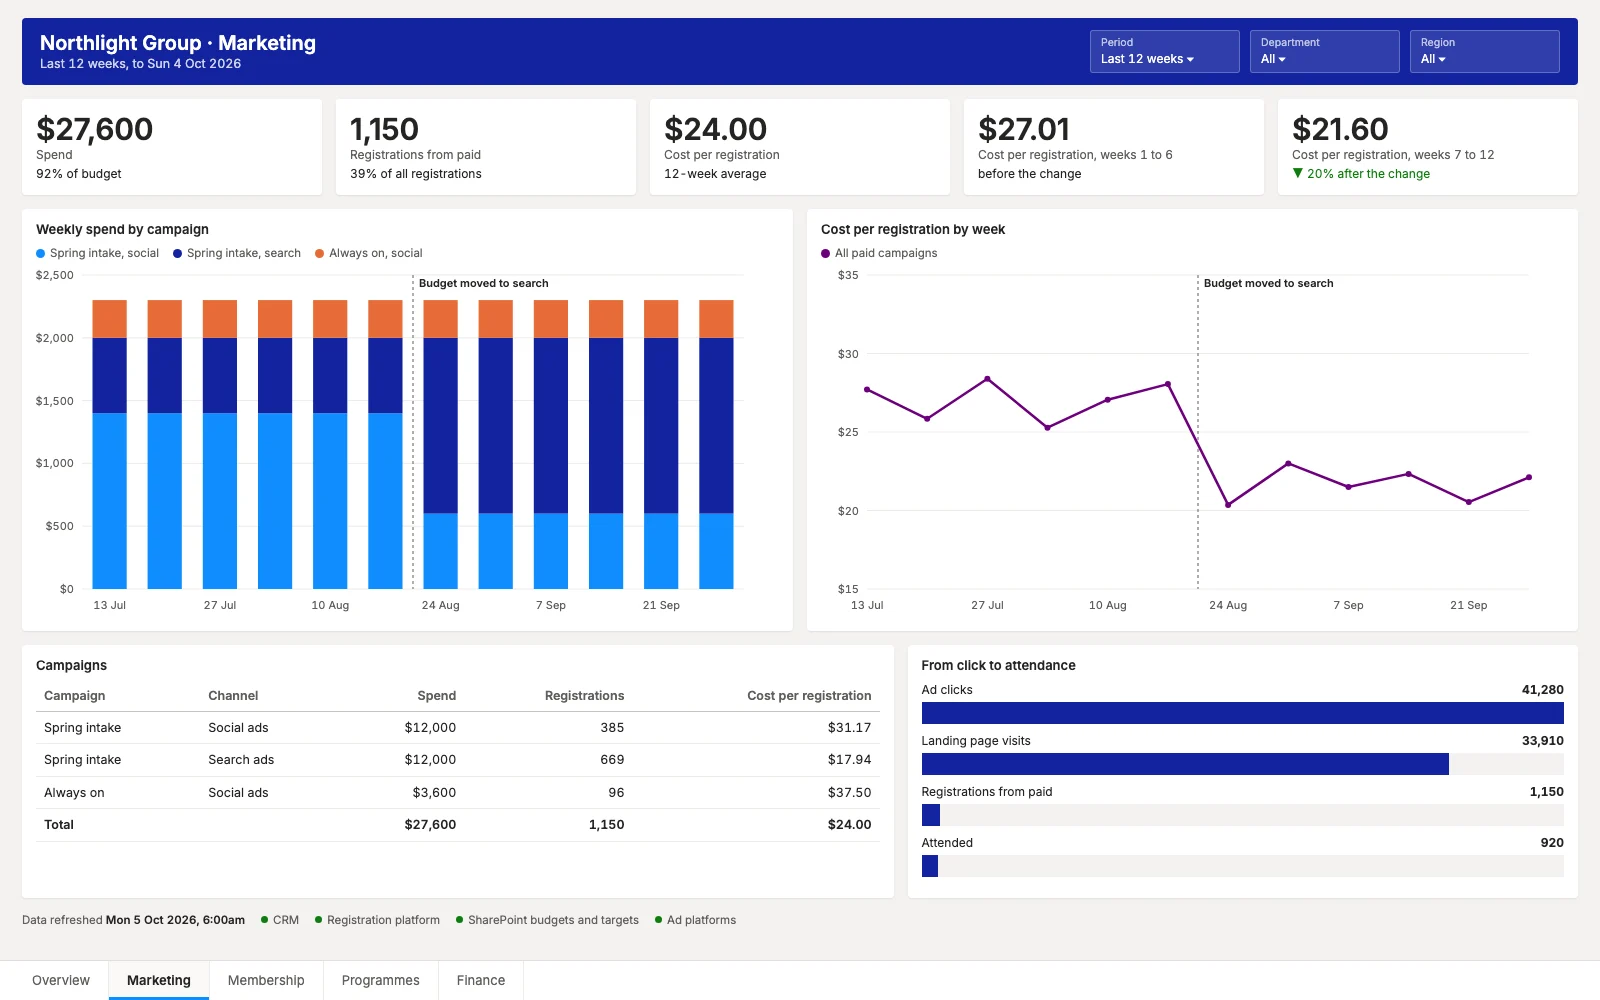
Spend by campaign next to what each registration cost, week by week, from the first click through to attendance. When one channel starts costing more than another, the next refresh shows it.
Sales in a CRM, jobs in a job management system, money in Xero, ads in Meta and Google. If someone exports reports and pastes them into a spreadsheet every month, the same approach applies: connect the sources once and let the reports refresh themselves.
Built by our founder in a previous role. Recreated with invented data: the real reports run in Power BI, and the organisation's name is removed.
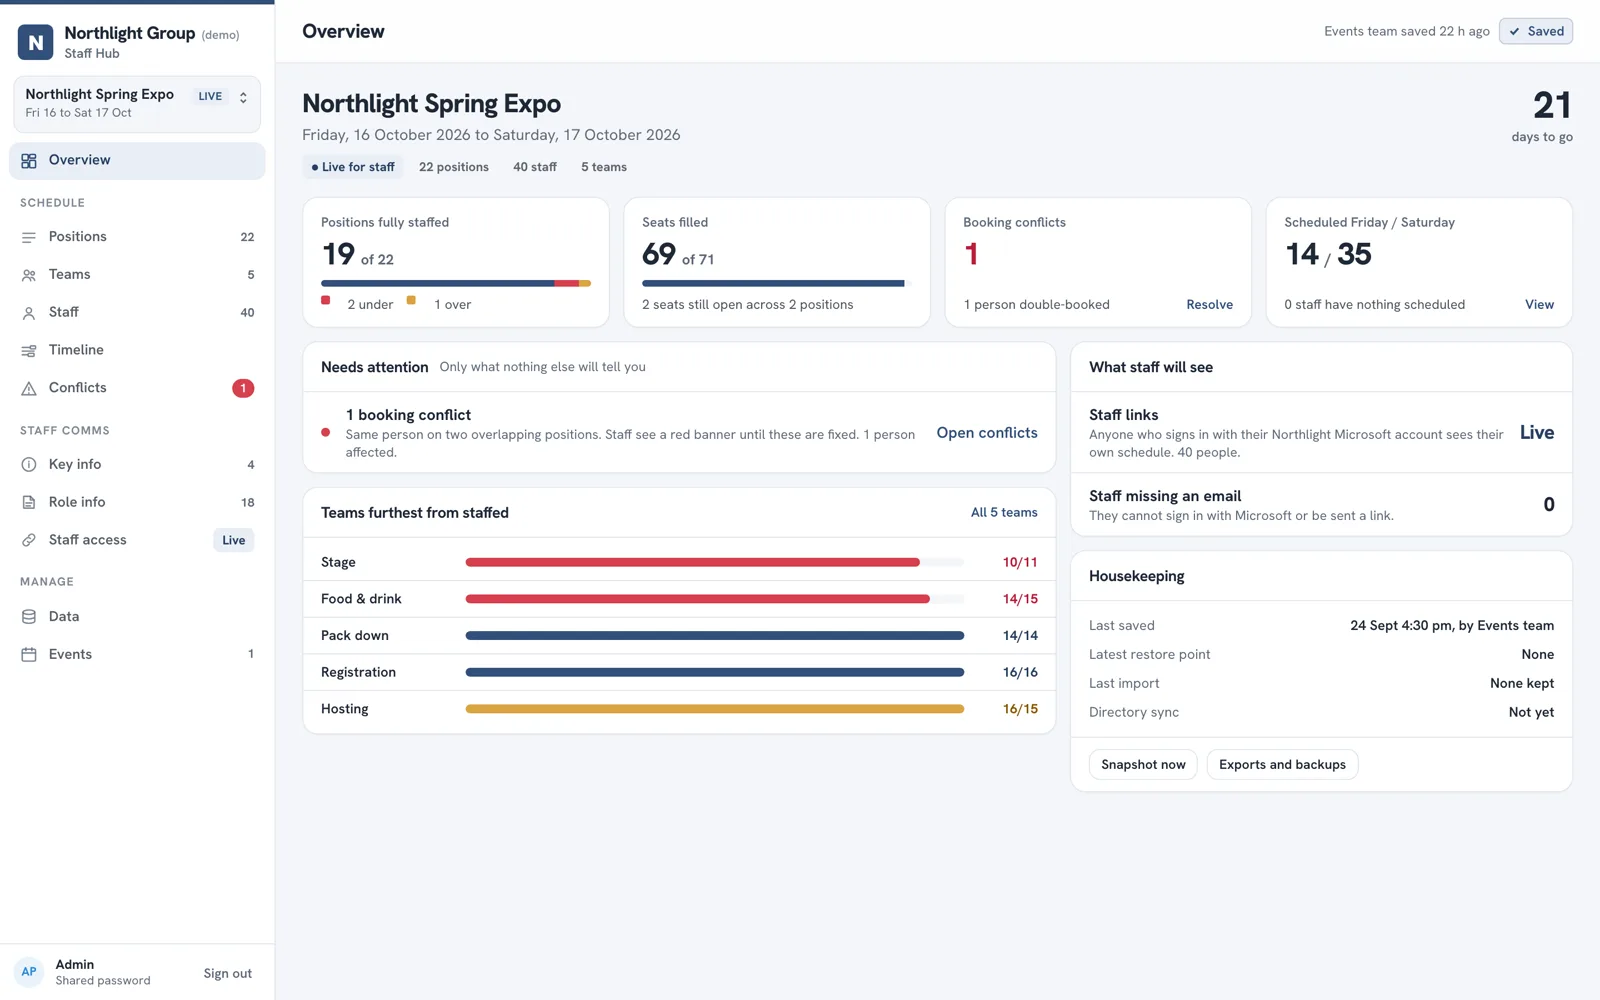
A scheduling app that took about 150 staff off the spreadsheet and into the browser.
Read the case study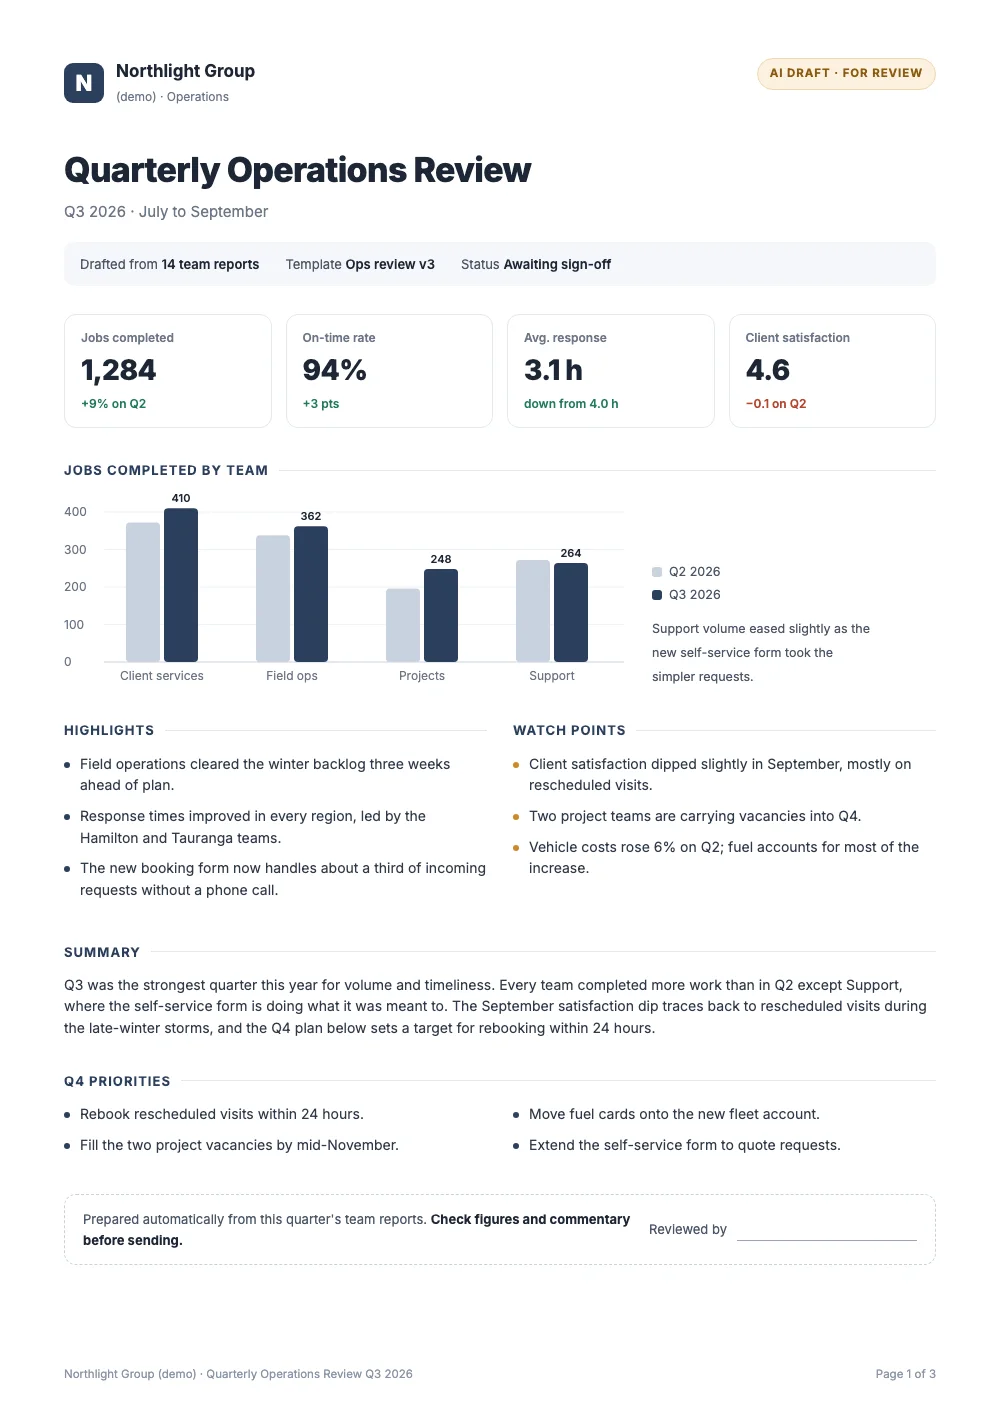
An AI report builder that cut a quarterly report from about four hours to under one.
Read the case study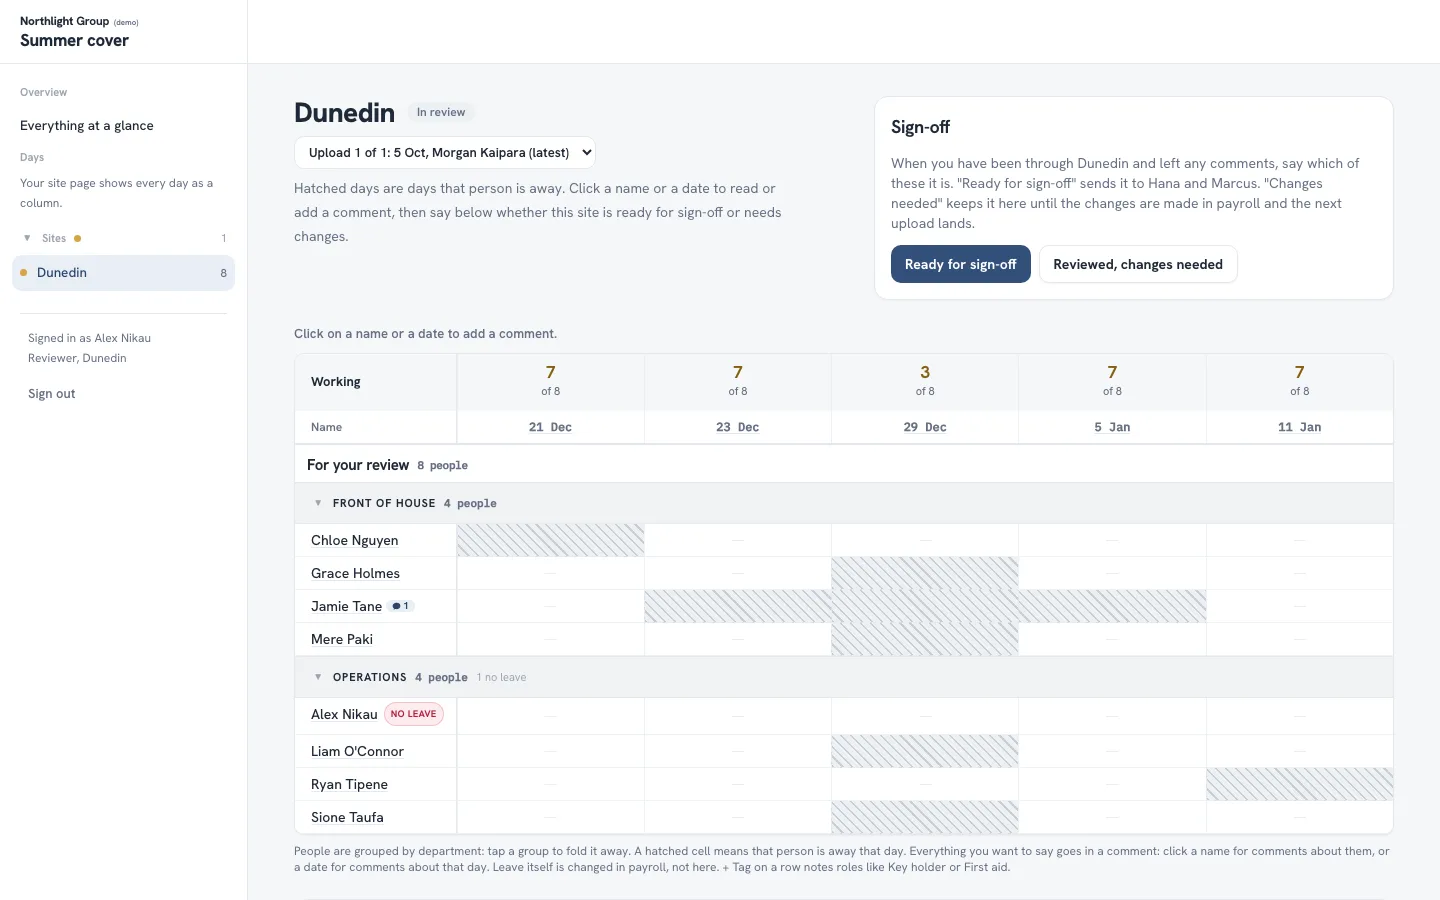
A planner that shows management who is on leave over summer at every office, with sign-off built in.
Read the case study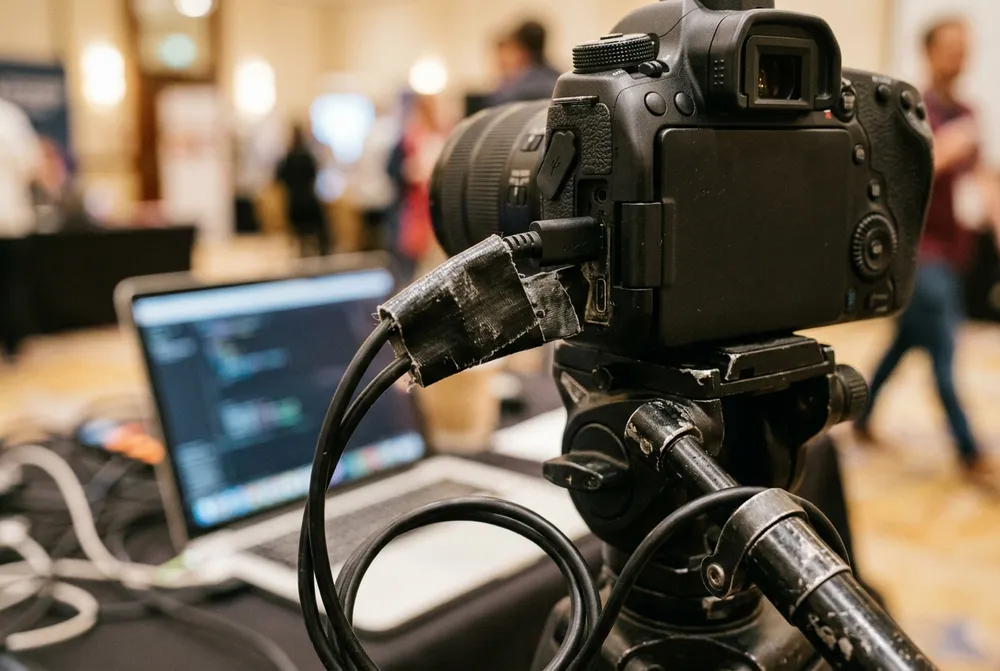
Our own product: guests get their event photos by email, usually within a minute.
Read the case study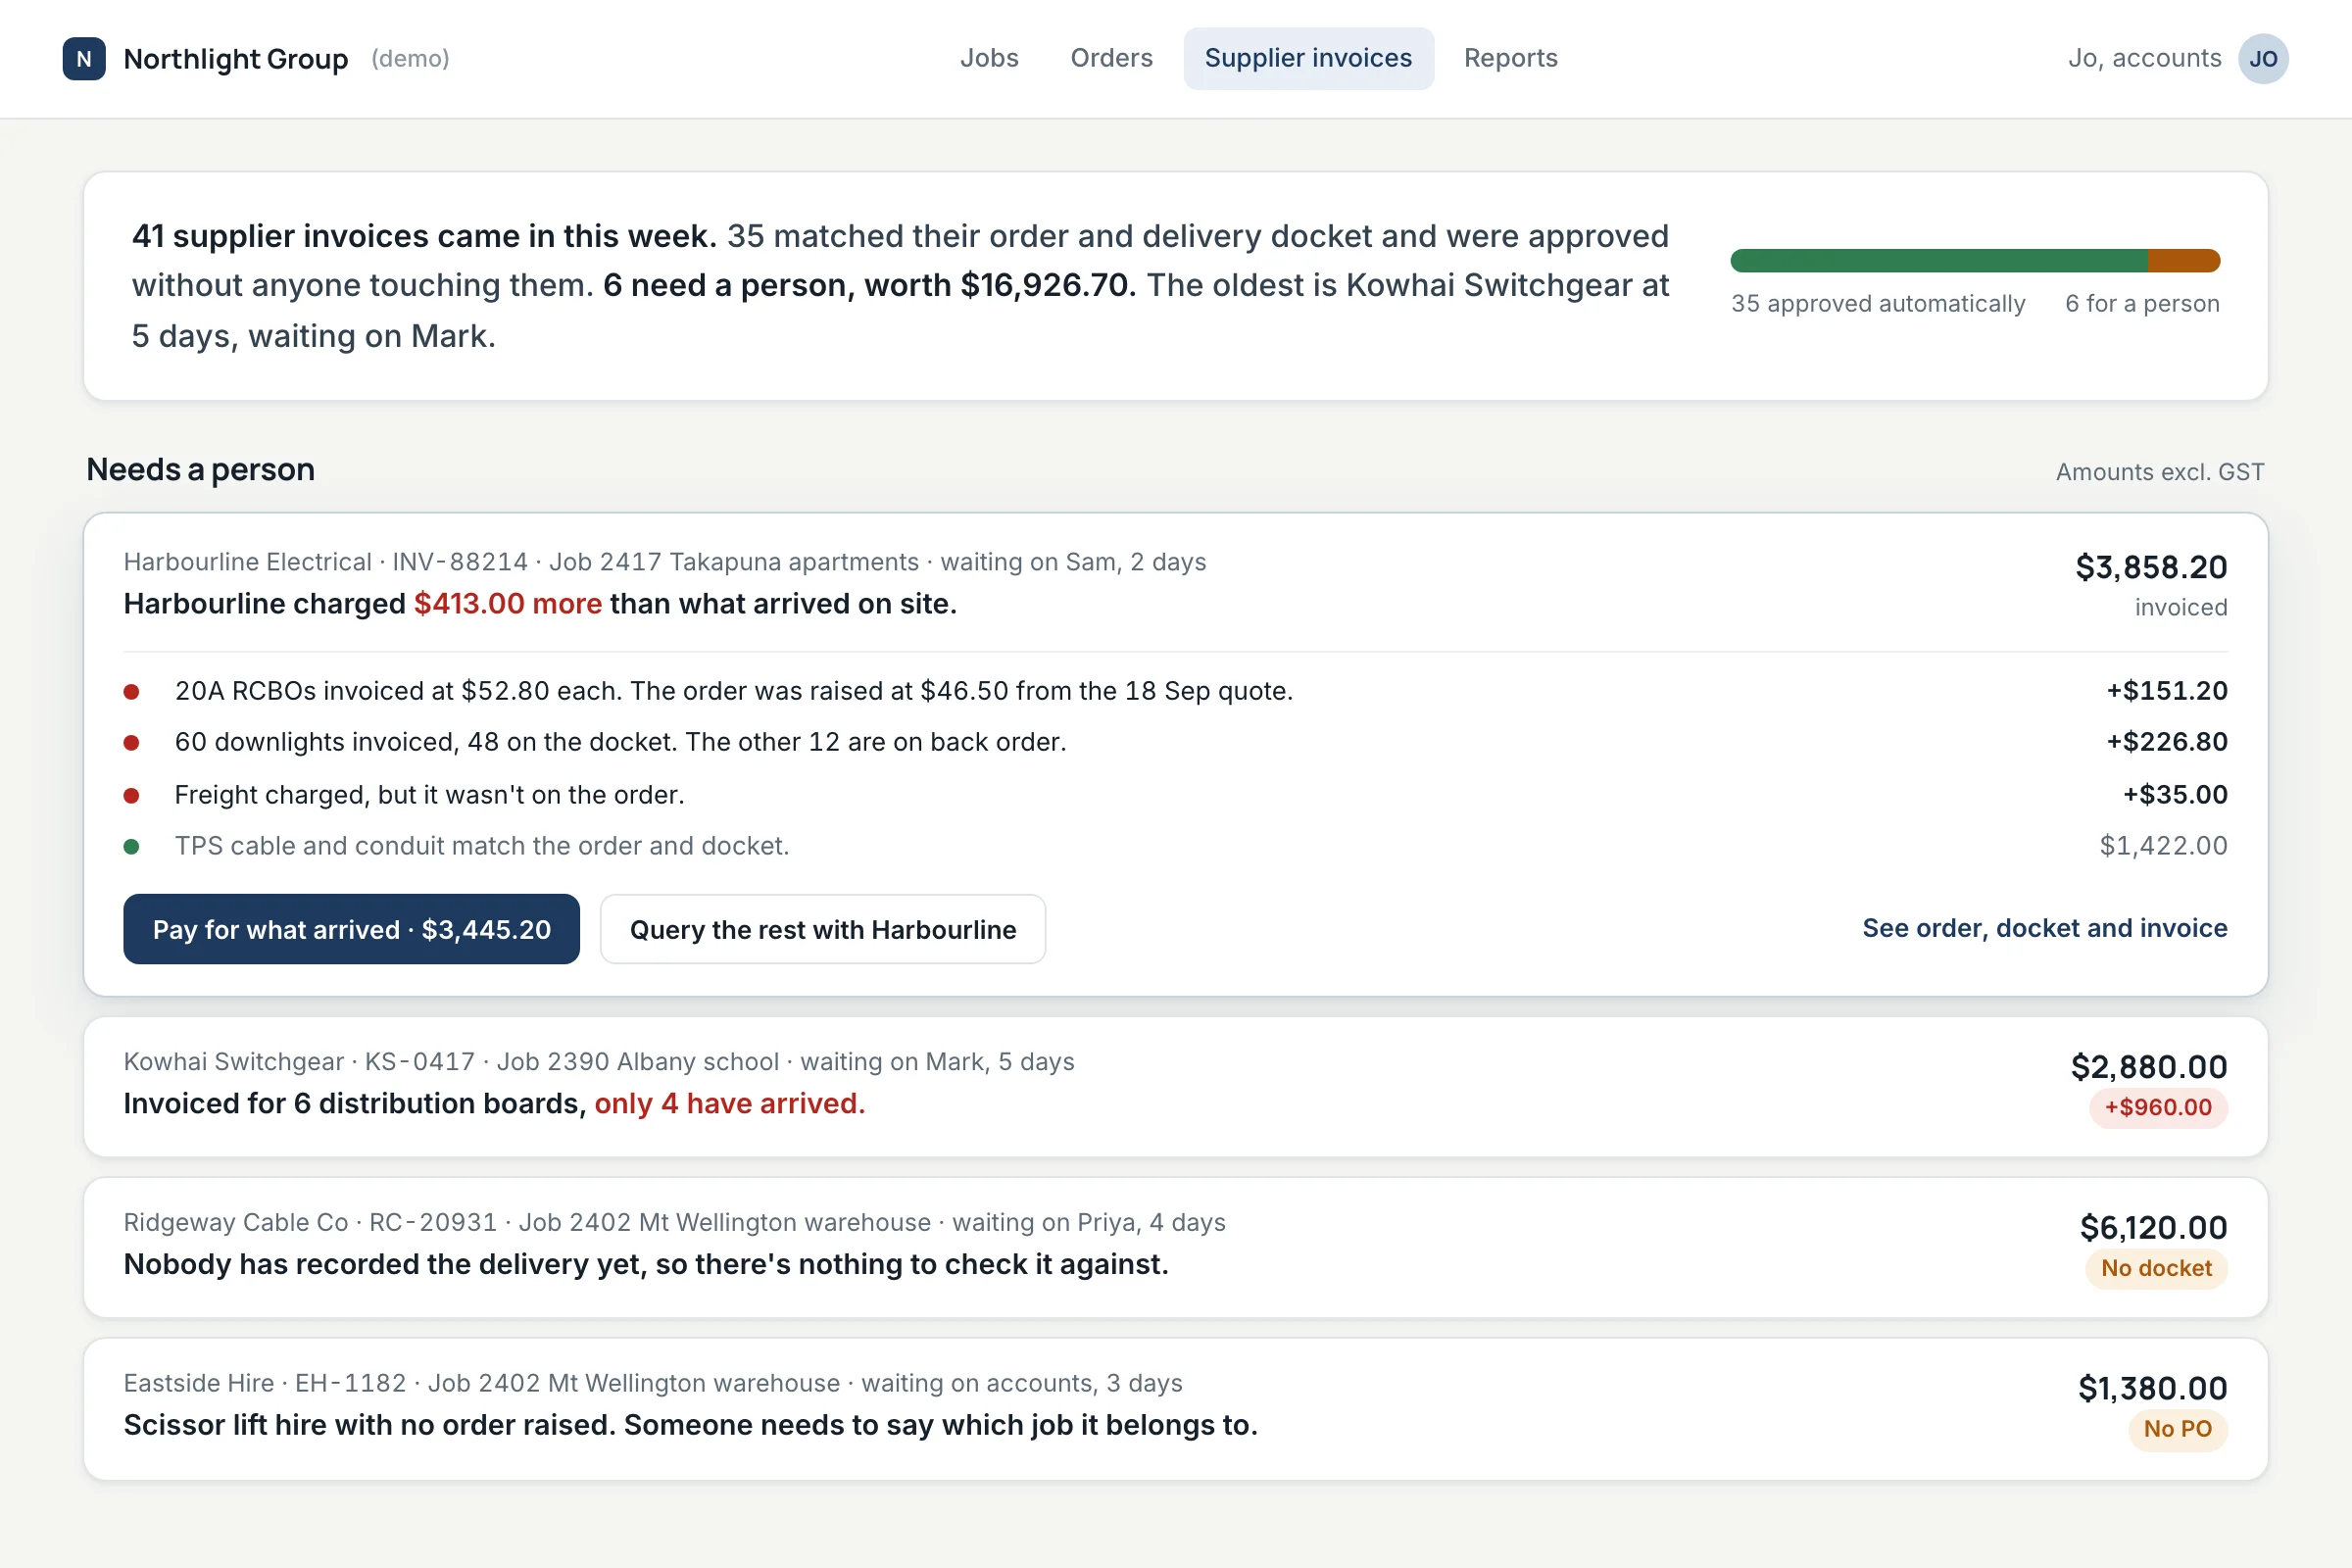
Invoices that match their order and docket go straight through. Only the differences reach a person.
See the demoTell us what's slowing your people down. The first call is free.